This is a guest post by Friggigatto
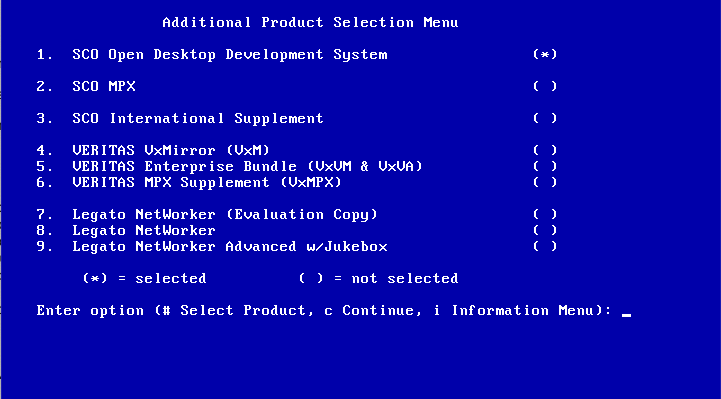
In the previous post we managed to install a Compaq-branded version of SCO Open Desktop. One of the recommendations was to use a small hard drive and avoid LBA, since SCO Unix does not recognize it.
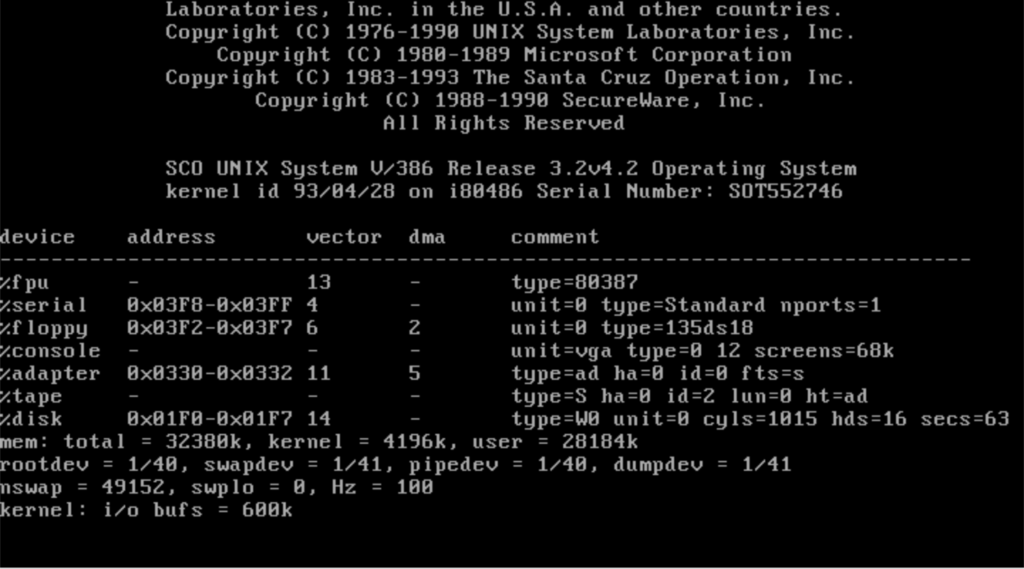
It turns out, however, that SLS UOD429A, the bootdisk + patch that we used in the first post of this series to install ODT, also adds LBA support (as found out on A.P. Lawrence’s excellent website).
Apart from enabling you to fully use larger disks (you can install on a disk larger than 2048 cylinders, as long as you set its size to 2048 cyls during installation; you are of course going to “waste” a lot of space), LBA is more convenient if you want to have a large root partition, since the root partition has to be entirely in the first 1024 cyls.
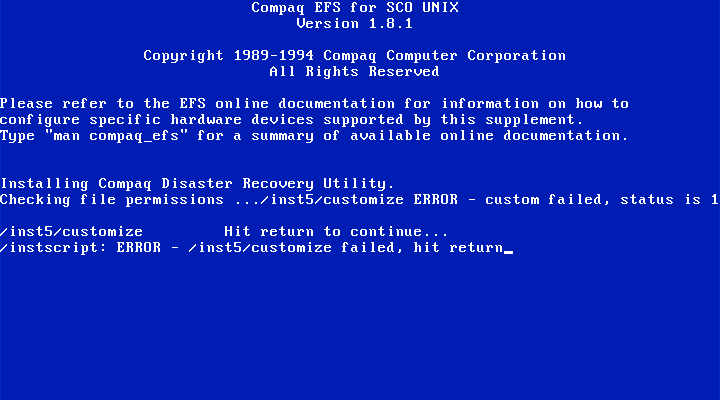
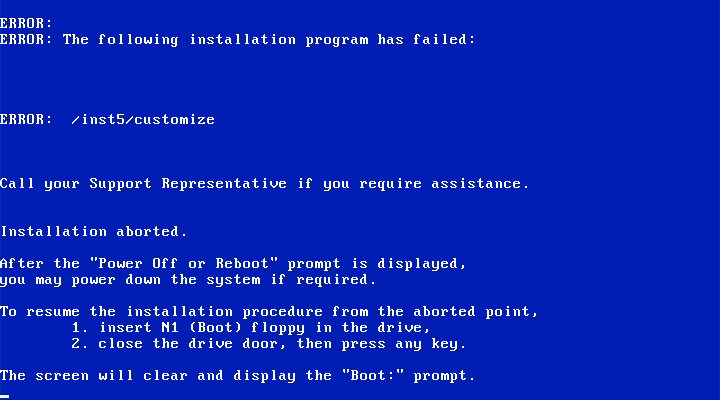
So of course I tried repeating the installation of the Compaq version by booting off UOD429A, inserting the N2 from SCO ODT, and… I quickly found out that it would not recognize the CD as a valid installation media. Annoying.
Eventually I found out that the N1 disk from Compaq has a ramdrive compressed in the kernel, from where the initial installation script is run, while the rest of the files (mostly installscript) are on the CD itself.
The fix was, in the end, relatively simple. All I needed to do was mounting the N2 floppy in the VM I had created before, copying “N2.Z” on my harddrive. I then uncompress-ed it, extracted it (it’s a regular tar file), and replaced the installation script with the one provided on Compaq’s CD. Then, the reverse process can be done: recreate the “N2” tar file, compress it, and copy it in the mounted N2 disk. If you don’t want to go through the same process again, you can download the patched disk.
The installation process is then simple: boot off UOD429A, insert the updated N2 disk when requested, and proceed with the rest of the installation as usual.
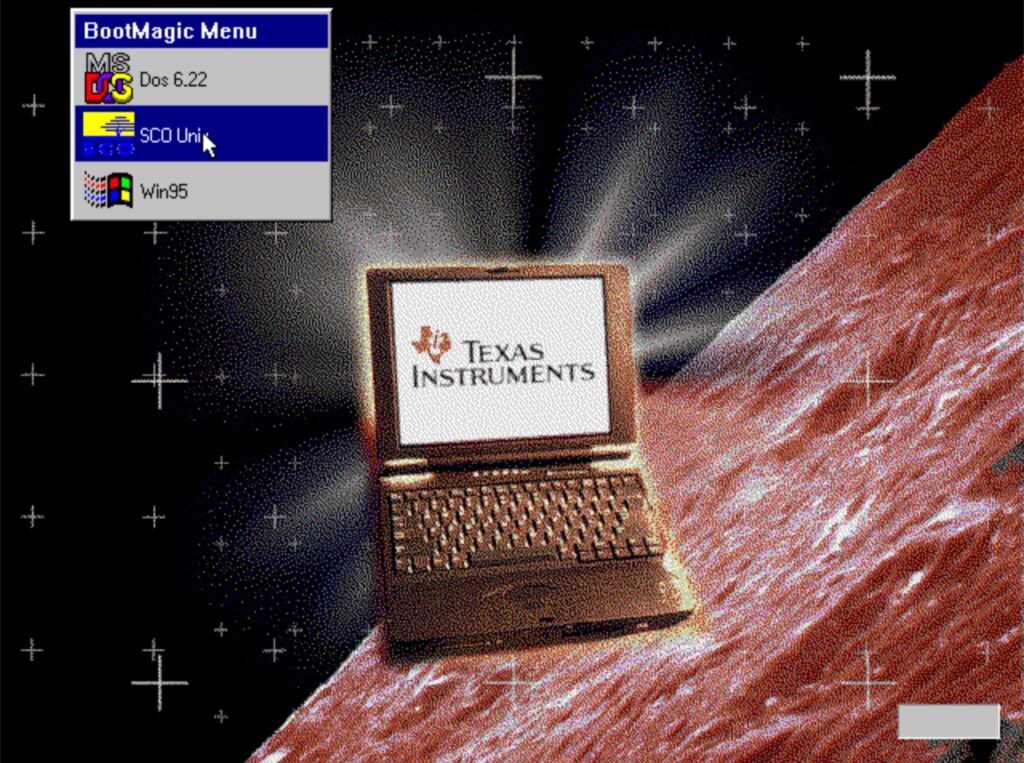
This way I managed to install SCO Unix on a TI TravelMate 6050, alongside DOS and Windows 95. It took a bit of trial and error (reading SCO technical support documents was, again, very helpful), but in the end this is more or less what I did:
- install Unix as LBA with a ~20mb DOS partition
- hide DOS partition & create a new one as primary active partition
- install Win95 on that
- install boot manager (I used Paragon’s Boot Magic) on first DOS partition (the hidden one)
Steps 1 and 2 were done in 86box, after creating a disk with the same cylinders, heads and sectors found in the BIOS of my TravelMate (using the LBA setting in the BIOS of both laptop and emulated machine, of course). After installing DOS and SCO Unix (I’m not sure anymore in which order), I copied the Win95 installation files on the new partition and finished the installation process on the laptop, after dd-ing the image to the CF card I’m using as hard drive.
After configuring Boot Magic (and creating a custom background and icon), now I’m greeted with this every time I boot up the laptop:
Since Windows 95 is installed in a FAT16 partition, I can mount it or access it via dosls/doscp inside SCO Unix too, which is convenient for sharing files (I tried installing a 3Com 3C589 PCMCIA card directly in Unix, since according to the docs it’s supported; unfortunately, the provided drivers only work with IBM PCMCIA controllers).
SCO Unix software
A large collection of ports for SCO Unix can be found at ftp.celestial.com, but it’s faster to use the ISO with all the ports I uploaded on archive.org.
To mount the CD with lowercase filenames, run #mount -rf HS /dev/cd0 /mnt
It’s worth noting that, before using the CD, we need to install it with mkdev cdrom (yes, even if we did install the whole system from a CD). In the process we will be asked whether we want a CD-ROM/TAPE device, which can be used to install more components for the system (CD-ROM/TAPE is the format used by the setup CD), and if we want to add to the kernel ISO9660 support, which of course we need. As usual, SCO documentation has a lot of information about this.
Gzip is included in the Celestial ports, but I also managed to compile an early version of bzip2 (here is the binary). If you compile it yourself use gcc, the code will be faster. The provided Makefile undefines __STDC__; gcc sets the flag and this creates problems at linking time, resulting in a call to a missing “__unlink” function.
Bonus content: recovery disks
In the process of getting more familiar with the installation process of SCO Unix, I realized I could benefit from having a set of spare bootdisks that would allow me to mount the hard drive and modify files at will (including after the first part of the installation process). So, I created them, using a ramdrive + compressed disk (similar to what SCO’s install process does, but also the boot floppy of Windows 98) to pack as many utilities as possible on a single disk.While I was at it, I did the same for Xenix 386.

